The amount of money states spend on VR services varies from year-to-year and state-to-state. For example, in 2008 Louisiana's combined agency spent $1.3K, while Georgia's combined agency spent $1.9K. In 2013, Louisiana spent less on VR ($0.8K), while Georgia’s spending remained the same.
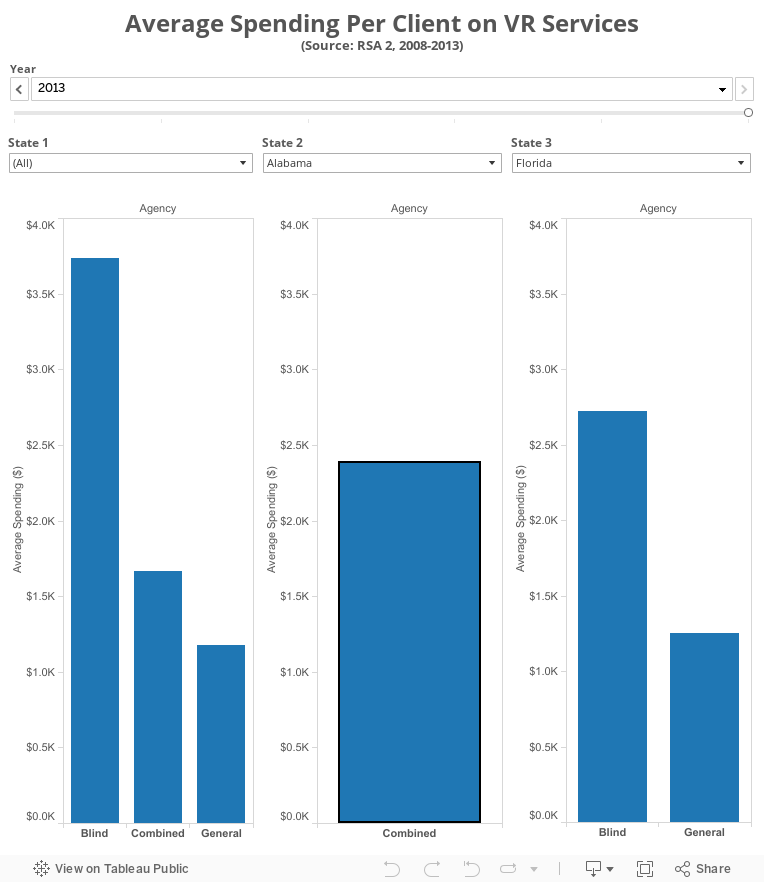
Description: This figure shows the average dollar amount states spent on VR services per consumer from the 2008-2013. The interactive state comparison shows the dollar values that general, combined, and blind agencies spent on these services and allows customizable comparisons of one state VR system to another.
Population: All VR clients
Data Source: RSA-2
Instructions: In this figure, the blue bars represent VR service values in each state. Place your curser over the bars to see corresponding dollar amounts for a given year in a state. Use the left and right arrows at the top of the figure to change the selected years and the drop-down menus to select desired state comparisons.