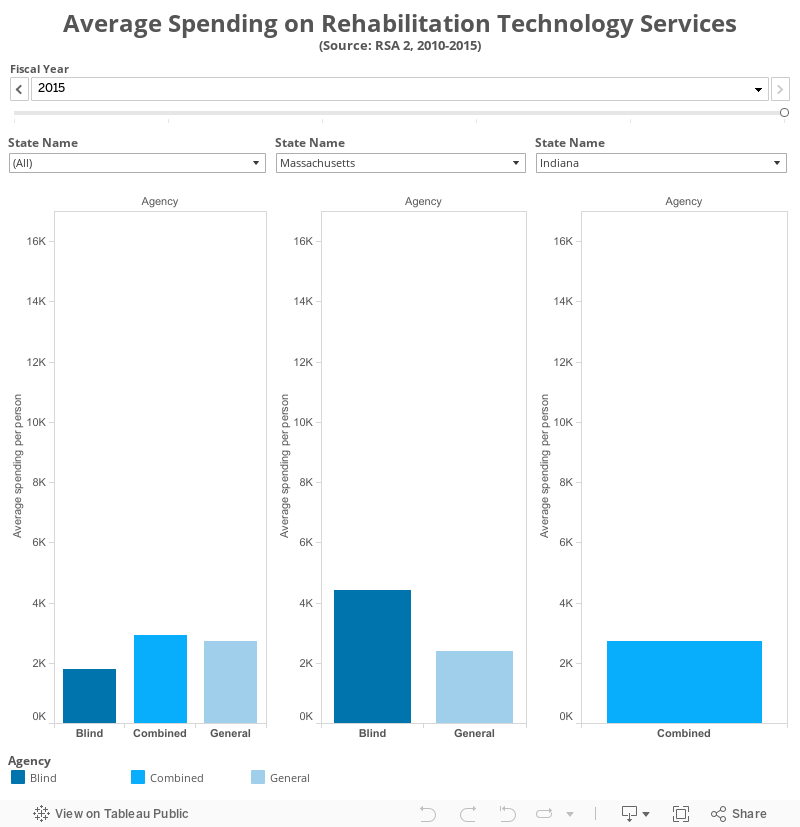
State Comparisons of Average Spending on Rehabilitation Technology Services
Description: This figure presents the average dollar amount the state VR systems spent on rehabilitation technology services from the years 2008-2013. The interactive state comparison shows the dollar values general, combined, and blind agencies spent on these services and allows comparisons of one state VR system to another.
Rehabilitation technology services may include applying technological solutions to help individuals with disabilities overcome barriers. The amount that VR agencies spend on rehabilitation technology services in comparison to their overall spending may vary from year-to-year and state-by-state. Average in this case was calculated by the total dollar amount spent on providing rehabilitation technology services and dividing it be total number of people who received that service.
For example, in 2013 Alabama and California's combined agencies each spent $2.2K, while Illinois combined agency spent $3.6K.
Population: All VR clients
Data Source: RSA-2
Instructions:In this figure, rehabilitation technology services values in each state are represented by blue bars. Users can place their mouse pointer over bars to see corresponding dollar amounts for any given year in any state. Use the left and right arrows at the top of the figure to change the selected years and the drop-down menus to select desired state comparisons.