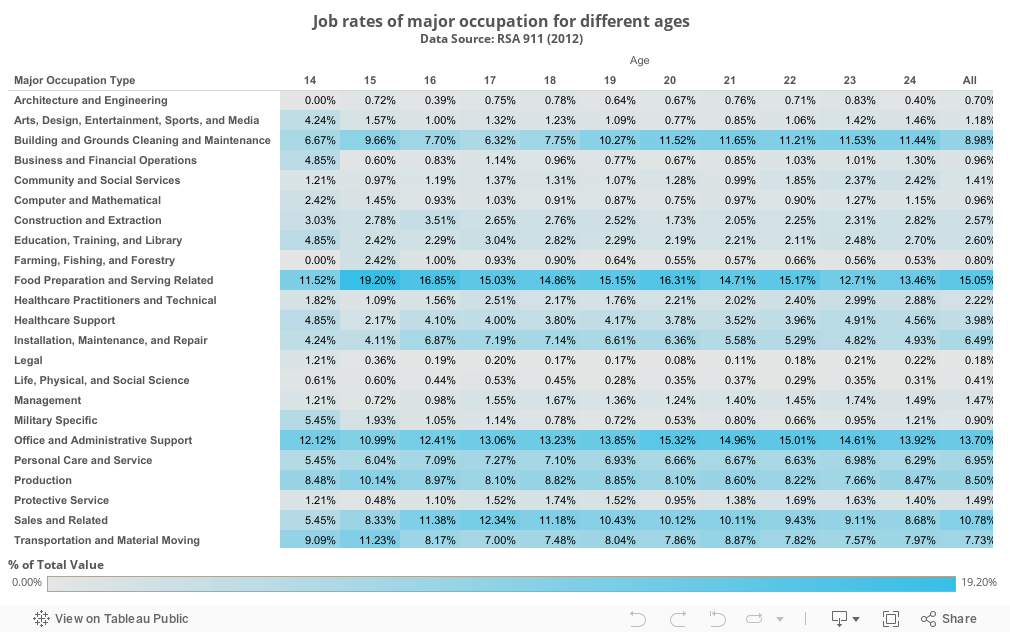
Transition age youth (ages 14-24) are primarily employed across three major occupation types:
- Food Preparation and Serving-related occupations
- Office and Administrative Support
- Sales and related occupations
In 2012, nearly 20% of 15 year-olds were employed in Food Preparation and Serving-related occupations. While this rate declines slightly as youth age, restaurants remain the most popular industry for teens and young adults ages 14-24.
Unsurprisingly, transition age youth are less likely to work in Legal occupations than any other major occupation. This occupation category includes jobs such as lawyers, judges, and mediators, which require higher levels of education.
To learn more about common jobs for VR consumers of all ages, read the analysis: Most Common Jobs for VR Consumers.
Description: This table displays the percentages of successful employment outcomes for youth ages 14-24 across major occupation types in 2012.
Data Source: RSA-911
Population: Transition-Age Youth
Chart Instructions: Read the chart columns to see the percentage out of 100% for a specific age (14-24) across all major occupation types. Darker shades of blue signify higher percentages.
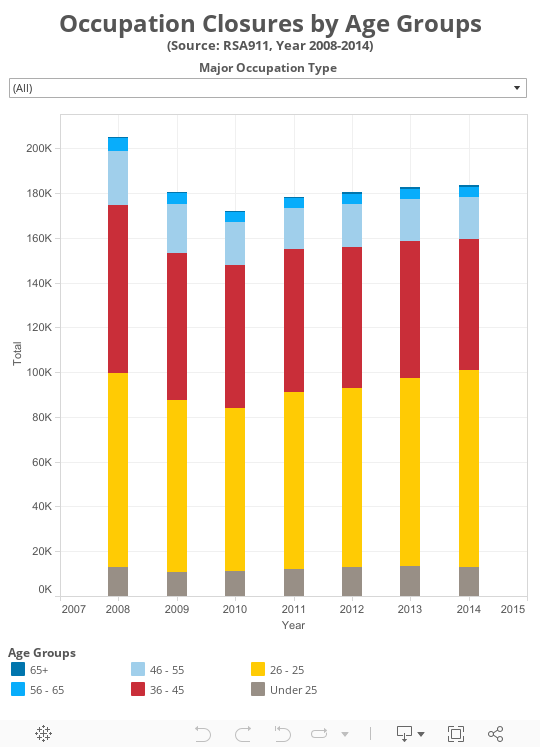
Description: This chart shows employment outcomes by age group and major occupation type from 2008-2014. This chart includes six age groups:
- Under 25 years (Transition Age Youth)
- 25-26 years
- 36-45 years
- 46-55 years
- 56-65 years
- Over 65 years
VR consumers from the second age group (25-26 years) were consistently more likely than consumers from any other age group to be employed in Food Preparation and Serving-related occupations. In 2014, 15,976 VR consumers in this age group were employed in the food service industry, compared to 1,960 VR consumers ages 26-45.
Data Source: RSA-911
Population: All VR Consumers
Chart Instructions:
Hover over the data points on each line to see the number of VR consumers employed in each age group. Click the dropdown menu to choose a major occupation type. The x axis shows the year and the y axis shows the number of VR consumers employed (by thousands).
Occupation Closures by Age Groups, 2008-2014