Annual Spending on Personal Assistance Services
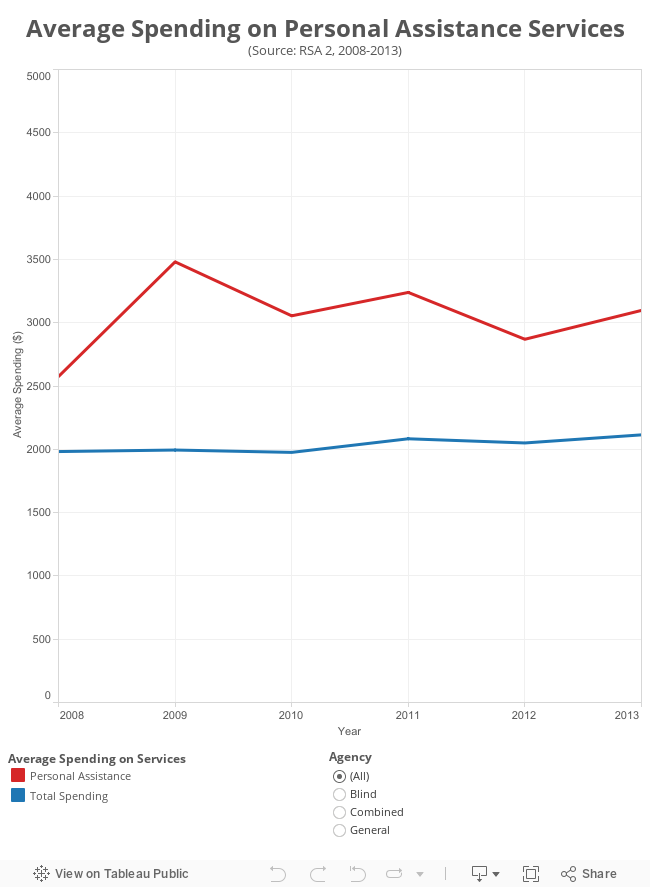
Description: This figure presents the national average of the dollar amount that a VR agency spent on personal assistance services from the years 2008-2013. The graph also shows the national average of the total dollar amount a VR agency spent in a given year.
Personal assistance services may include a range of services provided by one or more persons designed to assist an individual with a disability to perform daily living activities on or off the job that the individual would typically perform without assistance if the individual did not have a disability. The average dollar amount for this figure is calculated as the total amount spent on any given service divided by the total number of people who recieved that services. For calculating the average dollar amount for all the services, money spent on all the services was divided by total number of individuals who recieved any of the services.
The dollar amount that the national VR system spends on personal assistance services may vary from year-to-year. For example, in 2008 the VR system spent $2574.88 in personal assistance services. In comparison, in 2009, the VR system spent $3480.41 on personal assistance services.
Population: All VR clients
Data Source: RSA-2
Instructions: In this figure, personal assistance services dollar values are respresented by red, while total spending is indicated by the blue line. Users can place their mouse pointer over dots to see corresponding dollar amounts for any given year.