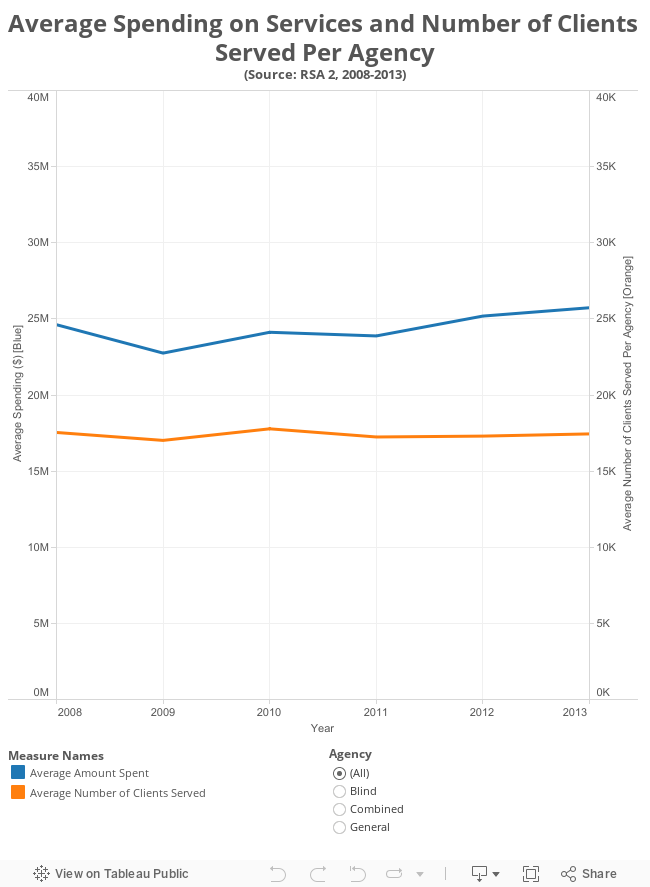
National Annual Spending on Vocational Rehabilitation Services
Description:This figure presents the dollar amount the nation spent on VR services from the years 2008-2013. The graph also shows the total number of clients that the national VR system served in a given year.
The dollar amount that the nation spends on VR services along with the number of clients the VR system serves may vary from year-to-year. For example, in 2009 the nation spent $1,744,611,300 on VR services while the VR system served 1,327,390 clients. In comparison, in 2011, the nation spent $1,838,687,345 on VR services while the VR system served 1,327,692 clients.
Population: All VR clients
Data Source: RSA-911
Instructions: In this figure, VR services dollar values are respresented by blue, while the number of VR clients served is indicated by the orange line. Users can place their mouse pointer over dots to see corresponding dollar amounts and clients served for any given year. Use the radio button to filter results by agency type.